Koristite zastareli preglednik. Možda se neće pravilno prikazivati ova ili druge veb stranice.
Trebalo bi da nadogradite ili koristite alternativni preglednik.
Trebalo bi da nadogradite ili koristite alternativni preglednik.
Epidemija CoViD-19
- Začetnik teme Zuma
- Datum pokretanja
[url=http://beobuild.rs/forum/viewtopic.php?p=729493#p729493:2v3qx9rr je napisao(la):Пантограф » Ned Apr 19, 2020 7:04 pm[/url]":2v3qx9rr]Duk, objašnjivo je: Rusi ne žive ni približno koliko Italijani ili Belgijanci - devedesetih je prosečan životni vek za muškarce bio 50 godina (!) - tako da je njima veliki broj onih koji bi umrli od korone u najvećem procentu uveliko već pod zemljom.
Taj podatak ima smisla ali ipak mislim da Putinova bikini statistika, što bi rekao Milojko, ima više veze sa malim brojem umrlih.
Reagujem jer Dragan napada zemlje zapadne evrope, braneći naše mere, a jedino te zemlje imaju neki smisao i plan u svemu ovome...i pre svega transparentnost.
Пантограф
Professional
- Učlanjen(a)
- 23.04.2012.
- Poruke
- 21.561
- Pohvaljen
- 49.695
Iz ovog savršenog teksta sa izuzetnim sagovornikom može se između redova zaključiti da se države snebivaju da uđu u proces širenja virusa među stanovništvom zbog toga što se o njemu još dovoljno ne zna. Obavezno pročitati, jer je tu sve:
https://www.nedeljnik.rs/profesor-r...las-i-novi-duzi-karantin-pogledajte-singapur/
U svakom slučaju, zemlje koje su sprovele izrazito stroge mere to neće moći da ponavljaju u beskraj tokom predstojećih godinu i po, do vakcine (ako je bude), jer će uslediti njihova potpuna propast.
@Duk
Kao prvo, materijalna greška. Poređenje statistike i bikinija nije Milojkovo, nego Zvonka Mihajlovskog
Drugo, ne znam koliko poznaješ Rusiju? Moram ti reći, tamo su mediji mnogo profesionalniji nego u Srbiji, bukvalno nije za poređenje. Nema tamo nikakvog Staljinizma, to su propagandne gluposti. O covidu 19, konkretno, dosta se informišem sa njihovih sajtova. Primećujem i da se globalni sistem informisanja na engleskom jeziku praktično raspao: izjavu dobitnika Nobelove nagrade za izolovanje HIV virusa da je koronavirus nastao u kineskoj laboratoriji, nisi mogao naći u engleskoj verziji narednog dana preko Google news pretrage. Kao ni mnoge druge, superzanimljive stvari vezane za pandemiju.
Takođe, treba reći i da je krizu Rusija dočekala sa 43.000 respiratora, a Italija, Francuska i Britanija sa po 5.000. Samo Moskva ih je imala koliko cela Italija. Ne bih potcenjivao Rusiju, to nema nikakvog smisla.
dragan
Professional
"Napadam zemlje zapadne evrope"[url=http://beobuild.rs/forum/viewtopic.php?p=729505#p729505:dsk51x7m je napisao(la):Duk » 19 Apr 2020 07:53 pm[/url]":dsk51x7m]Reagujem jer Dragan napada zemlje zapadne evrope, . .
https://www.worldometers.info/coronavirus/#countries
[url=http://beobuild.rs/forum/viewtopic.php?p=729504#p729504:1sxq4pw1 je napisao(la):GOJE » Ned Apr 19, 2020 7:48 pm[/url]":1sxq4pw1]Vrlo je verovatno da će ukupan broj umrlih za 2020. u većini evropskih zemalja čak biti niži od višegodišnjeg proseka.
Neće biti smrti od saobraćajnih nesreća, kriminala i ostalih slučajeva koji su teško izvodljivi zbog izolacije.
Ali ipak će covid skratiti neke živote koji bi dogurali do dogodine pa na dalje, tako da sam mišljenja da će biti porasta, ali blagog, ne za toliku dramu na koju smo trenutno primorani.
Iz tog razloga sam hteo i da doprinesem temi na forumu informacijama iz prve ruke, jer ipak kao što reče Zvonko (ne Milojko ispravka)-statistika je kao bikini[url=http://beobuild.rs/forum/viewtopic.php?p=729508#p729508:6ra5jbri je napisao(la):dragan » Ned Apr 19, 2020 8:00 pm[/url]":6ra5jbri]"Napadam zemlje zapadne evrope"[url=http://beobuild.rs/forum/viewtopic.php?p=729505#p729505:6ra5jbri je napisao(la):Duk » 19 Apr 2020 07:53 pm[/url]":6ra5jbri]Reagujem jer Dragan napada zemlje zapadne evrope, . .. . Samo citiram podatke sa ovog sajta.
https://www.worldometers.info/coronavirus/#countries
@Duk
Kao prvo, materijalna greška. Poređenje statistike i bikinija nije Milojkovo, nego Zvonka Mihajlovskog
Drugo, ne znam koliko poznaješ Rusiju? Moram ti reći, tamo su mediji mnogo profesionalniji nego u Srbiji, bukvalno nije za poređenje. Nema tamo nikakvog Staljinizma, to su propagandne gluposti. O covidu 19, konkretno, dosta se informišem sa njihovih sajtova. Primećujem i da se globalni sistem informisanja na engleskom jeziku praktično raspao: izjavu dobitnika Nobelove nagrade za izolovanje HIV virusa da je koronavirus nastao u kineskoj laboratoriji, nisi mogao naći u engleskoj verziji narednog dana preko Google news pretrage. Kao ni mnoge druge, superzanimljive stvari vezane za pandemiju.
Takođe, treba reći i da je krizu Rusija dočekala sa 43.000 respiratora, a Italija, Francuska i Britanija sa po 5.000. Samo Moskva ih je imala koliko cela Italija. Ne bih potcenjivao Rusiju, to nema nikakvog smisla.
[/quote]
@pantigraf,hvala za info, apsolutno ne poznajem Rusiju i uvek je zanimljivo kad se nešto novo nauči.
Njihova statistika mi je zapala za oko, jer je nerealno mala u odnosu na zapad, ali kad tako objasniš ima smisla.
A što se lapsus tiče, ne zameri, Grobar sam pa mešam zvezdin legende
MC_
Professional
- Učlanjen(a)
- 14.11.2017.
- Poruke
- 11.791
- Pohvaljen
- 12.086
[url=http://beobuild.rs/forum/viewtopic.php?p=729459#p729459:3ohkpik7 je napisao(la):Duk » Ned Apr 19, 2020 3:34 pm[/url]":3ohkpik7]Info za Belgiju, pošto se potencira da su u kolapsu sa mrtvima itd.
Svaki smrtni slučaj na koji se sumnjao da ima koronu, znači ne zvanično potvrđen, se registruje kao smrt od korone...tako su odlučili, pa posle će da vide.. Ne zanima ih statistika.
Narod opušten, nema panike, nema policijskog časa, veruju vlasti šta rade i poštuju mere, svako na svoju odgovornost.
Bravo!
MC_
Professional
- Učlanjen(a)
- 14.11.2017.
- Poruke
- 11.791
- Pohvaljen
- 12.086
[url=http://beobuild.rs/forum/viewtopic.php?p=729471#p729471:1q2uwkeq je napisao(la):Zuma » Ned Apr 19, 2020 4:27 pm[/url]":1q2uwkeq]
- U prvoj fazi razvoja epidemije i reagovanja na nju uglavnom zaslužuju pohvale zbog opšteg pristupa koji u našoj situaciji i bez vremena za pripremu i obrazovanje stanovništva verovatno više nije imao pravu altenativu. Sumnjam da bi zbog tako kasnog reagovanja države previše "dobrovoljnosti" (kao u nordijskim zemljama) kod nas dalo dobre rezultate.
Ima jedna poslovica "Treat people like idiots and they'll become idiots".
Znaci, tretiraj ljud ekoa id*** i oni ce postati id***.
Nismo imali sansu da pokazemo da nismo st***. Nisu nam dali sansu.
Nemiri u Berlinu, policija hapsila
Uprkos merama za smanjenje kontakata zbog pandemije koronavirusa, u centru Berlina održan je protest više stotina građana.
Oni su, kako su kazali, protestovali zbog ograničavanja njihovih prava.
Policija je na Trgu Roze Luksemburg legitimisala 79 osoba. Uhapšena su dva demonstranta, prenose nemački mediji.
Neki demonstranti nosili su plakate i ustav zemlje.
Policajci su, pored uobičajene opreme, nosili i zaštitne maske na licima.
[youtube]https://www.youtube.com/watch?v=Qp_1NFFRd2A[/youtube]
izvor: B92
mradulovic
Higher intermediate
promenjeno je samo iz jednog razloga - moramo pobediti virus, pa makar i friziranjem brojeva ljudi otpustenih iz bolnica. Izbori su za 2 meseca.[url=http://beobuild.rs/forum/viewtopic.php?p=729410#p729410:vuchgq52 je napisao(la):Zuma » 19 Apr 2020 12:32 pm[/url]":vuchgq52]Ovo je izgleda promenjeno više pod političkim pritiskom nego što za to postoji zdravo medicinsko opravdanje. Naše dosadašanje pravilo za otpuštanje iz bolnica (dva negativa testa, a ne jedan) je bilo u skladu sa preporukama Svetske Zdravstvene Organizacije. Ovo novo je suprotno tim preporukama. Evo šta SZO kaže[url=http://beobuild.rs/forum/viewtopic.php?p=729394#p729394:vuchgq52 je napisao(la):mradulovic » 19 Apr 2020 11:24 am[/url]":vuchgq52]juche je promenjen protokol za otpust iz privremenih bolnica - umesto da se ceka na rezultate dva testa, u toku 10 ili 14 dana, ljudi se otpustaju u kucnu izolaciju posle prvog testa
"According to the WHO’s guidelines on clinical management, a patient can be discharged from hospital after two consecutive negative results at least 24 hours apart."
https://www.theguardian.com/world/2020/ ... tive-tests
Postoji i ovaj Evropski dokument koji to malo relativizuje "ako je zdravstveni sistem pod ogromnim pritiskom", što kod nas tvrde da nije bio slučaj ni ranije, a pogotovo nije sad.
https://www.ecdc.europa.eu/sites/defaul ... iteria.pdf
Pravilo o dva vremenski odvojena negativna rezultata je uvedeno prvo zbog ugrađene verovatnoće greške od čak 30% u samom testu, a onda i zbog niza trenutno nepoznatih činjenica i varjabli od kojih zavisi količina detektovanih virusa u svakom pojedinom slučaju.
Zuma
Professional
- Učlanjen(a)
- 19.05.2009.
- Poruke
- 12.709
- Pohvaljen
- 28.791
Tekst je zaista veoma dobro i iscrpno napisan. Čak mi je bilo i zadovoljstvo da čitam tako retko jasno i logički precizno razvijanje ideje. Nažalost jedino se ne slažem baš sa njegovim osnovnim i najvažnijim zaključkom. A to je, ukratko, da je kovid ustvari isti kao teža forme gripa, uz činjenicu da grip teža bolest nego što narodu izgleda, i uz neke otežavajajuće aspekte kovida kao što je brzina širenja. Nažalost opet se stvar svodi na ključni nepoznati problem: koliko ima asimptotskih slučajeva u opštoj populaciji, tj koliko je njih već preležalo kovid a da za to i ne znaju?[url=http://beobuild.rs/forum/viewtopic.php?p=729506#p729506:inwbpcnn je napisao(la):Пантограф » 19 Apr 2020 06:56 pm[/url]":inwbpcnn]Iz ovog savršenog teksta sa izuzetnim sagovornikom može se između redova zaključiti da se države snebivaju da uđu u proces širenja virusa među stanovništvom zbog toga što se o njemu još dovoljno ne zna. Obavezno pročitati, jer je tu sve:
https://www.nedeljnik.rs/profesor-r...las-i-novi-duzi-karantin-pogledajte-singapur/
On prosto uzima neka istraživanja koja kažu da takvih ljudi ima puno, usput priznajući da trenutno zbog brzine rada nema ni jednog istraživanja koje je u skladu sa stogim normama naučne prihvatljivosti. SVI ti radovi bi u normalnim uslovima bili odbijeni. Potražio sam onaj kome on najviše veruje jer kaže
"Ovih dana nam konačno stižu prvi izvještaji iz Nizozemske, Danske, Italije, s Islanda, ali meni najvrjedniji od svih njih – od mog dugogodišnjeg znanca i iznimno cijenjenog kolege, profesora Johna Ioannidisa sa sveučilišta Stanford u Kaliforniji. Za njegovo mi se istraživanje čini da je najbolje dizajnirano i provedeno."
Evo ga ovde
COVID-19 Antibody Seroprevalence in Santa Clara County, California
https://www.medrxiv.org/content/10.1101 ... 20062463v1
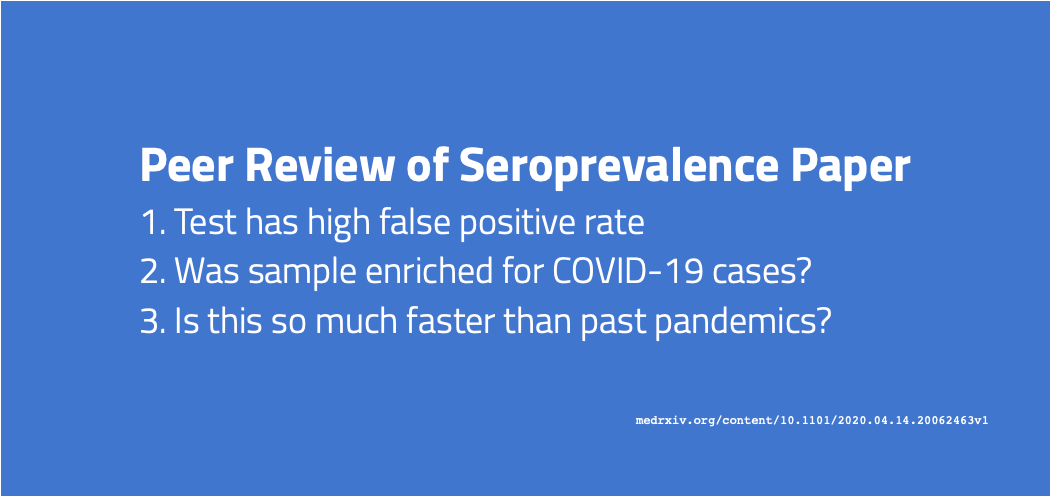
Pročitaj komentare ljudi koje su očigledno profesionalci jer je to usko stručni čaospis. Veliki broj njih dokazuje da rad nije ni trebao biti objavljen zbog nekoliko ogromnih metodoloških grešaka. U statistici, testovima itd. Ostali su uglavnom neutralni i traže još podataka, a nema praktično nikoga ko rad brani kao ispravan. A Rudan se ipak upravo na njega oslanja i hvali ga.
Takođe, još jedna detaljna kritika je ovde
https://medium.com/@balajis/peer-review ... 6382258c25
Mislim da još ne smemo da pretpostavimo bilo šta u vezi asimptotskih slučajeva u opštoj populaciji.
Пантограф
Professional
- Učlanjen(a)
- 23.04.2012.
- Poruke
- 21.561
- Pohvaljen
- 49.695
Pa, mislim da je intencija teksta da bi Rudan, kada bi bio 100% siguran u ova svojstva virusa, rekao: 'Pustite ga da protutnji kroz populaciju', ali da to, bez potpunijih saznanja, još ne može.
A i onda će biti teško, zbog demokratske strukture društva i medijske vladavine koju ona indukuje; da su pobedili drugi u Drugom svetskom, ili makar u Hladnom ratu, onda bi moglo, lako. Ali nisu. Jesu (ovi drugi) u Belorusiji.
A i onda će biti teško, zbog demokratske strukture društva i medijske vladavine koju ona indukuje; da su pobedili drugi u Drugom svetskom, ili makar u Hladnom ratu, onda bi moglo, lako. Ali nisu. Jesu (ovi drugi) u Belorusiji.
Zuma
Professional
- Učlanjen(a)
- 19.05.2009.
- Poruke
- 12.709
- Pohvaljen
- 28.791
Haotično stanje u Americi sa novim testovima na prisustvo antitela u krvi. To je onaj tip testova koji Dr Kon planira da radi na leto kod nas, a sigurno će ih raditi i sve druge zemlje, jer baš od toga zavisi merenje procenta postignutog stepena imunizacije stanovništva.
Antibody Test, Seen as Key to Reopening Country, Does Not Yet Deliver
https://web.archive.org/web/20200419171 ... tests.html
Antibody Test, Seen as Key to Reopening Country, Does Not Yet Deliver
https://web.archive.org/web/20200419171 ... tests.html
Zuma
Professional
- Učlanjen(a)
- 19.05.2009.
- Poruke
- 12.709
- Pohvaljen
- 28.791
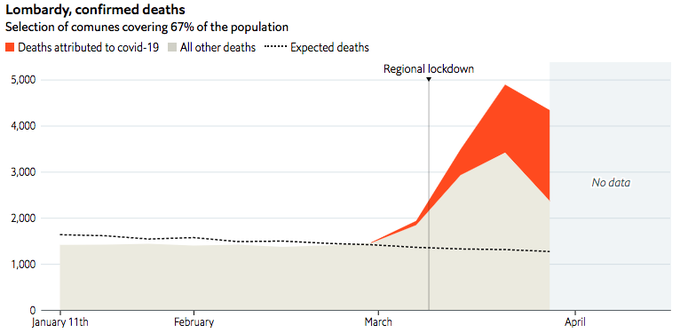
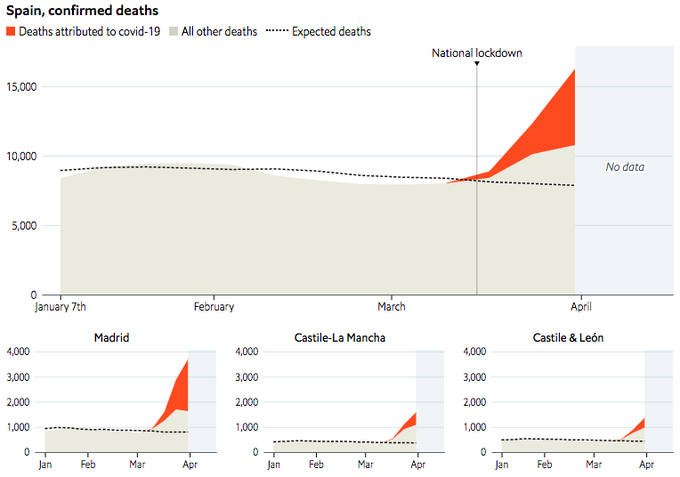
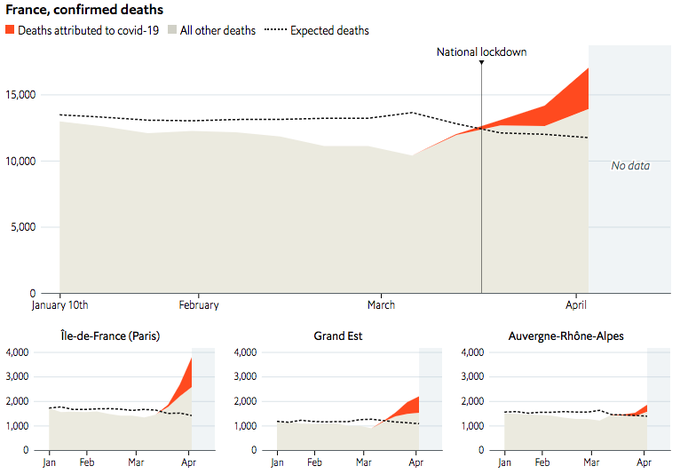
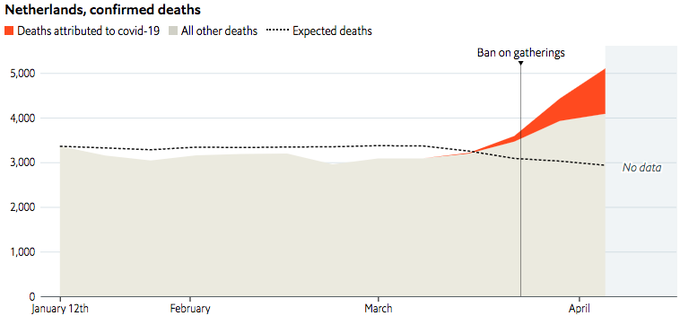
Data analitičar časopisa The Economist u ovoj seriji tvitova pokazuje da je broj umrlih od Covida19 (ili zbog drugih posledica epidemije) ustvari bitno veći nego što države objavljuju. Alaliza je rađena upoređujući broj smrti od svih uzroka u ovoj godini sa očekivanom brojem u ovoj godini dobijenim na osnovu podataka iz prošle godine i postojećeg trenda. Svuda se pokazuje da je broj smrti koje zvanično nisu pripisane Kovidu19 bitno veći od broja koji bi se u ovo vreme očekivao.
In most countries, the official death toll from covid-19 is a reasonable indicator of whether it is “flattening the curve”. @jburnmurdoch has produced some fantastic charts, tracking these statistics in scores of countries and regions.
But official daily death tolls, produced by national health ministries, understate the true number of people killed by the virus at that point. As @OurWorldInData and @MaxCRoser have explained, establishing the cause of death can take several days.
Moreover, most official death tolls only include people who tested positive or died in hospitals. As @EasyInve and @webecodibergamo found in Italy, total mortality data show that many other people passed away elsewhere.
So we have decided to aggregate data across countries. Using figures from @istat_it, covering 6.7m of 10m people in Lombardy, we found excess mortality of 9,000 in the 4 weeks to March 28th, compared with about 4,000 officially from covid.
In Spain, data from @SaludISCIII suggest 13,000 excess deaths in March, compared to 8,000 official. Like Italy, Spain’s daily totals rely chiefly on data provided by hospitals, so might miss many victims who die elsewhere, or were not tested.
In France, we used data from @InseeFr, which show excess deaths of about 8,000 people by April 3rd. The official death toll from hospitals was about 5,000 at that point. Since April 1st, the health ministry has included deaths from care homes, causing a large rise
In Britain, data from @ONS suggest excess deaths of about 7,000 in the four weeks to April 3rd. A revised count of covid cases—using death certificates, rather than daily data from hospitals—came to 6,200 in the same period.
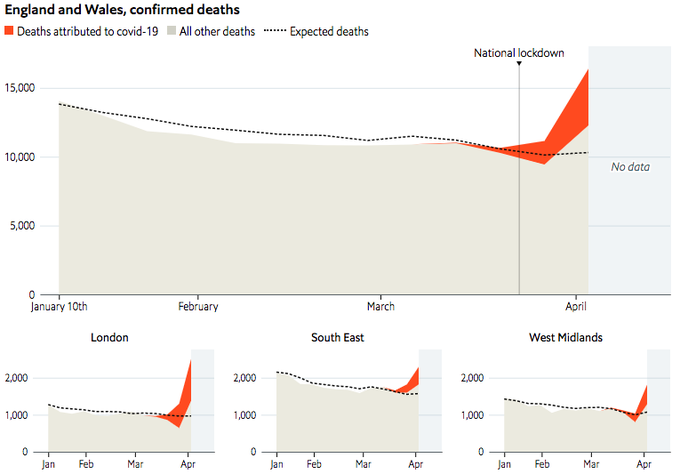
In the Netherlands, data from @statisticscbs show a large undercount: 4,000 excess deaths in the four weeks to April 5th, vs 1,700 official at that point. This might explain why the current official toll of 3,100 is so low.
Most American states are slow to update their total mortality data, but New York City has published weekly data until March 28th via @CDCgov. At this point, they showed an excess mortality of 1,400 in the previous four weeks, vs 1,100 official deaths.
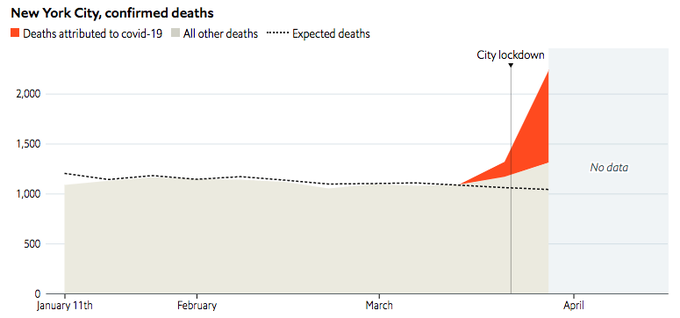
However, more recent aggregated data from NYC show that excess mortality in the four weeks to April 11th was at least 7,000, and probably much higher. The city has recently started to count “probable” victims, who died without testing positive.
https://t.co/R5sXiah18S?amp=1
Most of these data are several days old—unfortunately, the spikes in excess mortality will become much greater in the coming weeks. We will display those as soon as reliable figures come through.
Ostalo pročitajte na
https://twitter.com/i/status/1250815341044924425
In most countries, the official death toll from covid-19 is a reasonable indicator of whether it is “flattening the curve”. @jburnmurdoch has produced some fantastic charts, tracking these statistics in scores of countries and regions.
But official daily death tolls, produced by national health ministries, understate the true number of people killed by the virus at that point. As @OurWorldInData and @MaxCRoser have explained, establishing the cause of death can take several days.
Moreover, most official death tolls only include people who tested positive or died in hospitals. As @EasyInve and @webecodibergamo found in Italy, total mortality data show that many other people passed away elsewhere.
So we have decided to aggregate data across countries. Using figures from @istat_it, covering 6.7m of 10m people in Lombardy, we found excess mortality of 9,000 in the 4 weeks to March 28th, compared with about 4,000 officially from covid.

In Spain, data from @SaludISCIII suggest 13,000 excess deaths in March, compared to 8,000 official. Like Italy, Spain’s daily totals rely chiefly on data provided by hospitals, so might miss many victims who die elsewhere, or were not tested.

In France, we used data from @InseeFr, which show excess deaths of about 8,000 people by April 3rd. The official death toll from hospitals was about 5,000 at that point. Since April 1st, the health ministry has included deaths from care homes, causing a large rise

In Britain, data from @ONS suggest excess deaths of about 7,000 in the four weeks to April 3rd. A revised count of covid cases—using death certificates, rather than daily data from hospitals—came to 6,200 in the same period.

In the Netherlands, data from @statisticscbs show a large undercount: 4,000 excess deaths in the four weeks to April 5th, vs 1,700 official at that point. This might explain why the current official toll of 3,100 is so low.

Most American states are slow to update their total mortality data, but New York City has published weekly data until March 28th via @CDCgov. At this point, they showed an excess mortality of 1,400 in the previous four weeks, vs 1,100 official deaths.

However, more recent aggregated data from NYC show that excess mortality in the four weeks to April 11th was at least 7,000, and probably much higher. The city has recently started to count “probable” victims, who died without testing positive.
https://t.co/R5sXiah18S?amp=1
Most of these data are several days old—unfortunately, the spikes in excess mortality will become much greater in the coming weeks. We will display those as soon as reliable figures come through.
Ostalo pročitajte na
https://twitter.com/i/status/1250815341044924425
dragan
Professional
"Izgubljena sezona za pčelare"
Zbog zabrane kretanja, veliki deo pčelara u Srbiji ne može da obiđe svoje pčelinjake u ključnom mesecu za pčelarstvo. Posledice bi mogle da budu nesagledive - i za pčelare, ali i za voćare. . . .
https://www.b92.net/biz/vesti/srbija.ph ... id=1676629
Srećom ja vidim sa prozora košnice na susednom brdu iz kojih kupujem med. Pčelar živi u blizini, pa ću opet kupiti 10-12kg meda, ali tražiću neki popust, jer vidim da njegove pčele dolaze po polen na moje voćke.
Poznat je tvoj anticrkveni stav ali kao novinar se bar malo informisi, nemoj da budes isti kao naprednjaci. Imas izvore na netu, ali to nije atraktivno za tebe verovatno.vucko":4lcu4qmw je napisao(la):A ni Srbi ne bi bili Srbi da ne brane SPC koja nije ni donirala ni dinar za borbu protiv ovog virusa jer je prezauzeta gradnjom elitnih stambenih naselja.
astrodule
Professional
Ovo sa pčelarima je očigledan primer nesposobnosti svih od lokalne samouprave do državnog vrha.
Decenije partijskog zapošljavanja (negativne selekcije) se najbolje vidi na ovom primeru. Pogledajte samo komentare koji to i potvrđuju.
Decenije partijskog zapošljavanja (negativne selekcije) se najbolje vidi na ovom primeru. Pogledajte samo komentare koji to i potvrđuju.
paradox polje
Advanced
Мој снабневач меда је пчелар који је у пензији и нема никог ко би уместо њега знао и могао одржавати кошнице. Шта ће човек отишо у илегалу и кришом обилази своје кошнице.
dragan
Professional
"Galenika proizvela 372.000 tableta leka hlorokin"
. . iz Kine je u četvrtak stiglo 160kg supstance i Galenika je za kratko vreme uspela da se organizuje i da počne sa proizvodnjom. . .
https://www.b92.net/biz/vesti/srbija.ph ... id=1676756
. . iz Kine je u četvrtak stiglo 160kg supstance i Galenika je za kratko vreme uspela da se organizuje i da počne sa proizvodnjom. . .
https://www.b92.net/biz/vesti/srbija.ph ... id=1676756
Bender Rodriguez
Professional
- Učlanjen(a)
- 12.03.2017.
- Poruke
- 27.750
- Pohvaljen
- 64.882
Počinjem da osećam sve veće gađenje prema ovim gluperdama širom sveta što se bune protiv zabrana kretanja - protestovanjem u grupama.
Od svih primera koje sam video, oni Ameri u Mičigenu (koje, priznajem, jesam ismevao) ispadoše i najmanje zlo. Oni su bar većinski bili u automobilima. Dok ovi u Sao Paolu i Berlinu pokazuju nulti nivo inteligencije i odgovornosti.
Brazil je za svega par dana dostigao broj od čak 40.000 zaraženih. Neko bi rekao - pa dobro, 40.000 na 210 miliona ljudi, nije to mnogo. Da, ali kad se uzme u obzir da je 40.000 zaraženih na 60.000 testova u zemlji od 210.000.000, tu se odmah jasno vidi koliko su neodgovorno pristupili celom problemu, i koliki ih haos tek čeka.
Uopšteno, i pre, i za vreme, i posle Korone, gadim se ljudi koji bi glupavim, destruktivnim i besmislenim metodama raznih vrsta da se bore protiv vlasti ili nekog problema. Vlast se kažnjava na izborima, bojkotima ili prosto štrajkovima nalik onima u Japanu (proguglajte ako ne znate kako oni to rade). Ovo majmunisanje po ulicama u vreme najgore pandemije, dok svet još ne zna ni sve činjenice o Koroni i njenoj transmisiji... to je u rangu ''Rušimo Beograd što je Kosovo proglasilo nezavisnost''. Slepčine.
astrodule
Professional
Previše glupih i neobrazovanih se prave pametni. Znate li kada bismo rešili problem sa Variolom da su postajali takvi pametnjakovići koji bi pametovali o vakcinaciji i slobodi kretanja.
Problem sa zabranama je što se to izgleda krši sa Ustavom, ali tako je to sa pravom. Nije to matematika pa da nema proizvoljnih tumačenja.
Što se tiče "pametnih", njih najbolje opisuje već pominjana Daning-Krugerova kriva

Naravno, oni su "zakucani" na 100% i ne mrdaju odatle.
Problem sa zabranama je što se to izgleda krši sa Ustavom, ali tako je to sa pravom. Nije to matematika pa da nema proizvoljnih tumačenja.
Što se tiče "pametnih", njih najbolje opisuje već pominjana Daning-Krugerova kriva
Naravno, oni su "zakucani" na 100% i ne mrdaju odatle.
Bender Rodriguez
Professional
- Učlanjen(a)
- 12.03.2017.
- Poruke
- 27.750
- Pohvaljen
- 64.882
Slažem se u potpunosti. I da, Kruger-Daningov efekat i sam primećujem svakog dana. Hvatajući sebe kako sumnjam u previše svojih procena, dok gledam tocila oko sebe koji su puni samopouzdanja i ide im brale ko od šale. Ne mislim na Koronu, nego generalno.
Zato sam i postao rezervisaniji u komentarisanju cele ove situacije, jer je sve postalo izuzetno nepredvidivo i kompleksno. Ono što sam ranije kritikovao kod naših su većinski bile kritike vezane za: ponašanje, nastup, atmosferu, teranje iz jedne krajnosti u drugu, kontradiktorne izjave stručnjaka, aljkavost u sitnicama koje nekome život znače (npr nemanje tople vode na Sajmu do skora) i uvođenje takvih mera da se ljudi dva dana gomilaju u redovima, pa tri dana sede kućama, pa se dva dana potom opet gomilaju u redovima. Kao i majmunisanje Grada sa javnim prevozom, koji je bio rasadnik zaraze i umesto da se o njemu povede računa (dok je grad bio otvoren), on se smanjio prvi put, pa drugi put na subotnji red vožnje, a sve to u vreme dok je sve u gradu još uvek radilo.
Za ostalo sam gledao da ne komentarišem previše jer znam koliko ne znam a i video sam od starta da postoji više škola misli kako rešavati ovu krizu.
Ali ono što znam sigurno je da: 1) protestovanje u grupama i 2) arlaukanje dok nisu izbori a ostajanje u kući kad dođe dan za zaokruživanje... neće doneti ništa dobro. Od Aljaske do Australije.
Ovaj profesor je mozda strucnjak ali je u velikoj svadji sa logikom.[url=http://beobuild.rs/forum/viewtopic.php?p=729506#p729506:2xg2pi9w je napisao(la):Пантограф » Ned Apr 19, 2020 7:56 pm[/url]":2xg2pi9w]Iz ovog savršenog teksta sa izuzetnim sagovornikom može se između redova zaključiti da se države snebivaju da uđu u proces širenja virusa među stanovništvom zbog toga što se o njemu još dovoljno ne zna. Obavezno pročitati, jer je tu sve:
https://www.nedeljnik.rs/profesor-r...las-i-novi-duzi-karantin-pogledajte-singapur/
Kaze COVID je u rangu sa tezim gripom, i navodi primer Italije, gde je pre par godina od gripa umrlo 20-25.000 ljudi za sezonu.
A upravo je ovo dokaz protiv te njegove trvrdnje, jer je od COVID-a u Italiji do sada (dakle daleko od kraja epidemje) i pored nezabelezenih mera karantina umrlo isto toliko ljudi. Znaci da nije bilo mera a i do kraja epidemije bi umrlo daleko vise.
Danas su nas preplavile protivrecne informacije, jos moramo da slusam svakakve nebuloze o teorijama zavere i vakserima, ovde bih citirao legendu:
https://www.youtube.com/watch?v=KyBgFjtwEcU
Preporučite:

